Data atlas / commodity
WTI Oil Spot Price
Oil carries significant fat tails and negative skew. High volatility tends to push the price down.
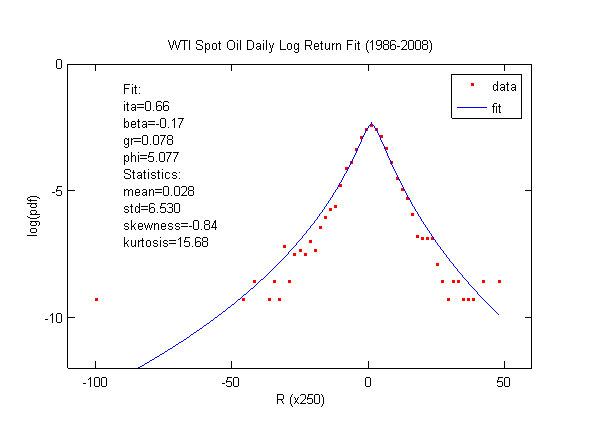
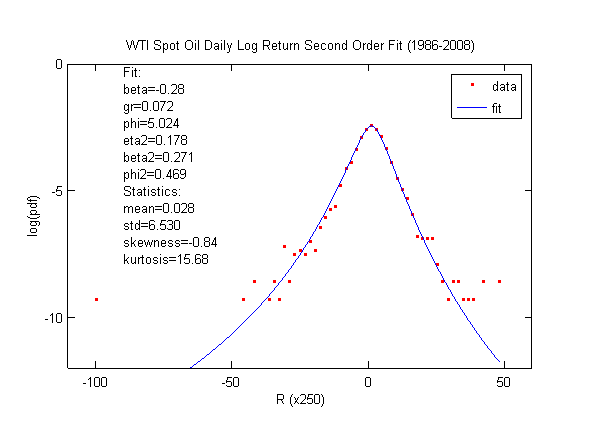
Oil price has significant fat tails, so energy costs should not be expected to move smoothly. It also has negative skewness like the Dow: high volatility causes the oil price to go down.
The first order fit overestimates the variance and the peak probability. The second order fit corrects both. This indicates that oil price has observable volatility of volatility.
Data source: US Energy Information Administration, Cushing, Oklahoma spot price series.
Related fits
Compare the shape.
Source shelf
Data and further reading
- EIA WTI spot pricesWest Texas Intermediate spot price history.
- LBMA precious metal pricesLondon benchmark prices and market data.
- World Gold Council dataGold price data and market research.
- Cboe GVZThe Cboe dashboard for the gold volatility index.
- Federal Reserve Economic DataEconomic time series from the Federal Reserve Bank of St. Louis.
- Lihn 2008 on SSRNThe 2008 working paper on the scale invariant Brownian motion model.
- Lihn 2009 on SSRNThe working paper on higher order lognormal cascade distributions.
- Clark 1973Subordinated stochastic process model for speculative prices.
- Fat tailed distributionsA reference overview of heavy tailed probability distributions.
- Lognormal distributionDefinition and properties of the lognormal distribution.
- Mandelbrot 1963The variation of certain speculative prices.
- Stochastic portfolio theoryA reference overview of stochastic portfolio theory.