Data atlas / stock index
Dow Daily Log Return for 80 Years
The longest equity record in the archive. Daily returns from 1928 to 2008 show the most prominent fat tails and the clearest need for a higher order fit.
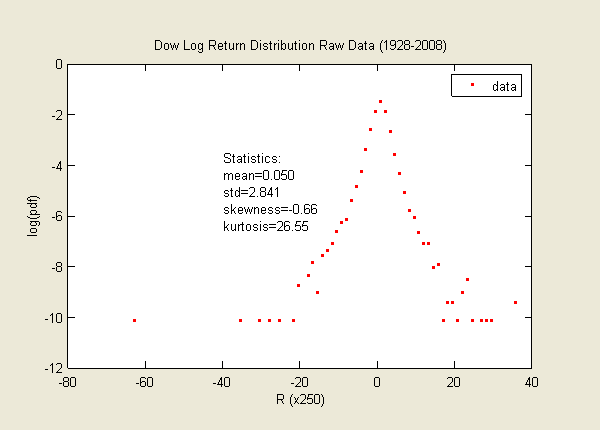
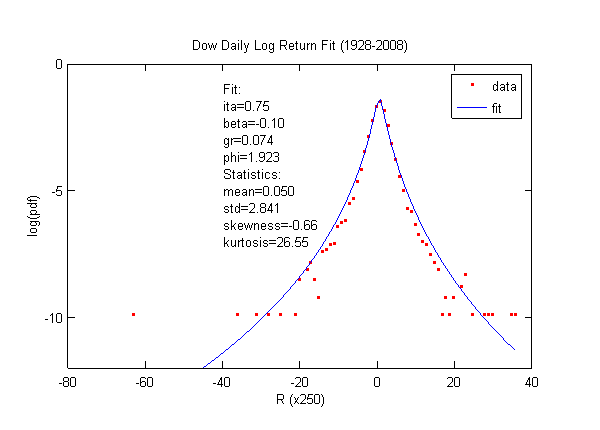
Simply looking at the raw data should be enough to see that the skew lognormal cascade distribution is a strong candidate. Fitting fat tailed data is not easy. I first remove the two extreme outliers at the far left and far right, then run the fitting routine.
Tails weigh heavily in skewness and kurtosis, so I compare both with their theoretical values and require a mean that is slightly positive. The first order fit is close, but the fitted curve is slightly fatter than the data. To fit skewness and kurtosis, the standard deviation overshoots by 18 percent.
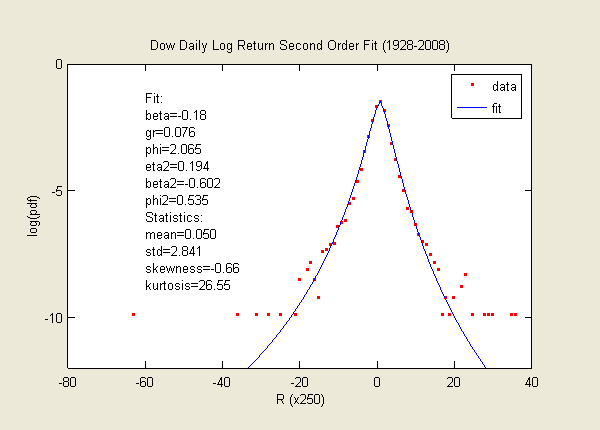
The cause is the visible fat tailed volatility of the Dow. The higher order distribution addresses it. Eta is high for the daily return. The ten day study used eta = 0.5; fitting one day returns gives eta = 0.7. The scaling law is at work: eta rises as the interval falls, and kurtosis rises with eta.
The second order fit is the best fit across the first four moments and the vicinity of peak probability density. The second order distribution includes a term analogous to the volatility of volatility. The detail was published in June 2009.
Data source: Yahoo Finance.
Related fits
Compare the shape.
Source shelf
Data and further reading
- Yahoo FinanceMarket data and historical quotes used for several series.
- Nasdaq CompositeOfficial index information for the Nasdaq Composite.
- Nikkei marketsJapanese market data and index information from Nikkei.
- FTSE Russell US indicesIndex information for the Russell 2000 and related benchmarks.
- Federal Reserve Economic DataEconomic time series from the Federal Reserve Bank of St. Louis.
- Lihn 2008 on SSRNThe 2008 working paper on the scale invariant Brownian motion model.
- Lihn 2009 on SSRNThe working paper on higher order lognormal cascade distributions.
- Clark 1973Subordinated stochastic process model for speculative prices.
- Fernholz 2002Stochastic portfolio theory and the diversity index.
- Heavy tailed distributionsA reference overview of distributions with heavy tails.
- Lognormal distributionDefinition and properties of the lognormal distribution.
- Stochastic portfolio theoryA reference overview of stochastic portfolio theory.