Data atlas / US stocks
Blue Chip Stock Daily Log Return Fits
Twelve large US companies over three decades. Their kurtoses cluster around 10, with eta near 0.5 to 0.6.
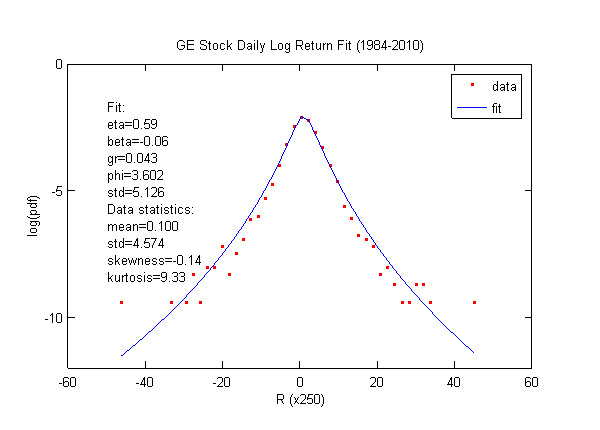
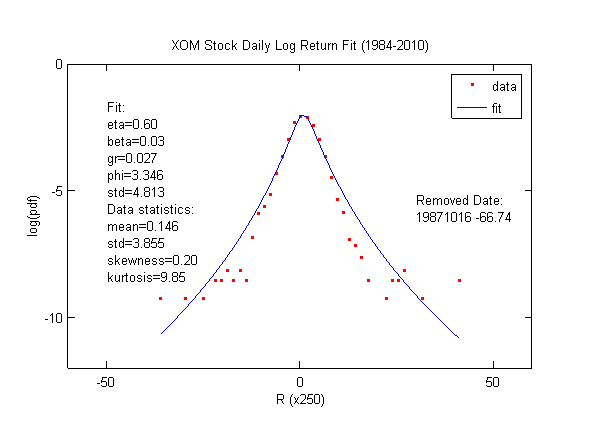
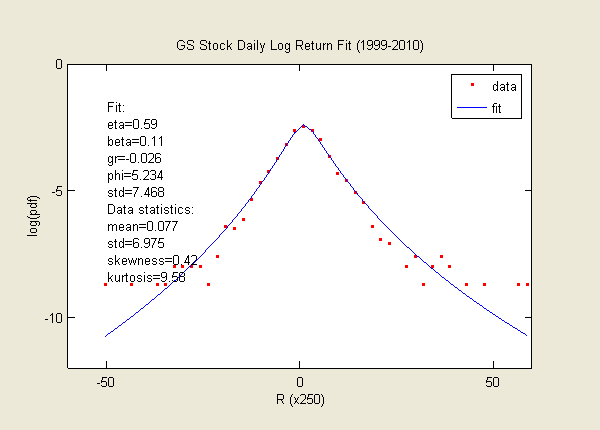
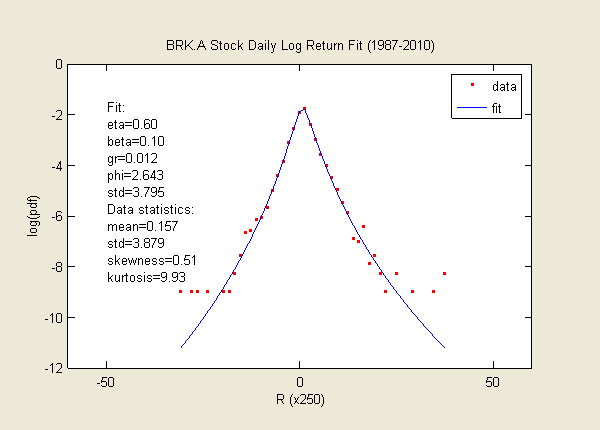
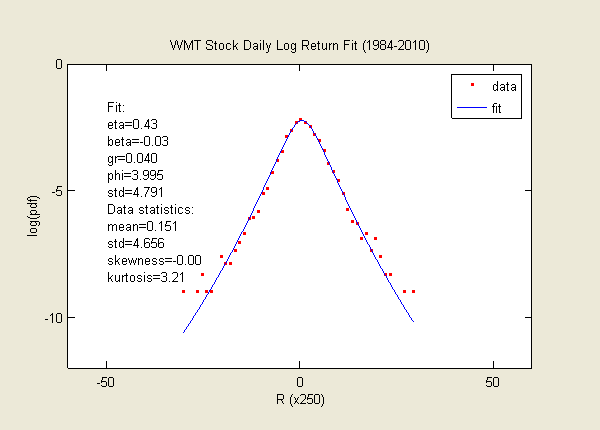
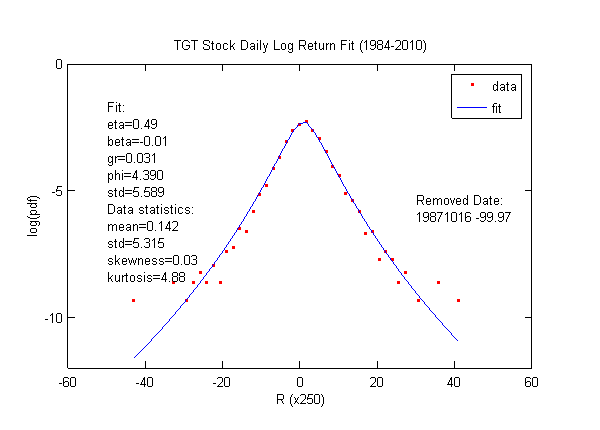
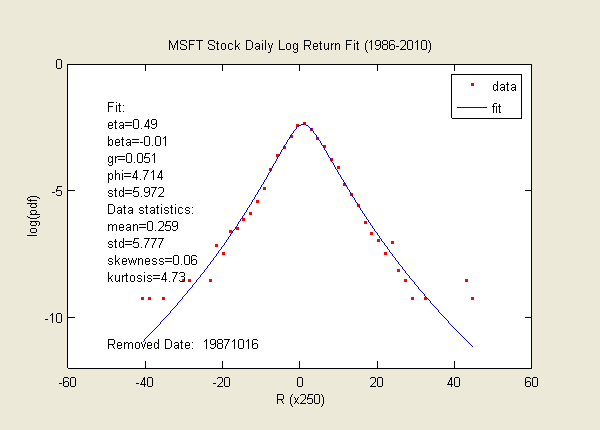
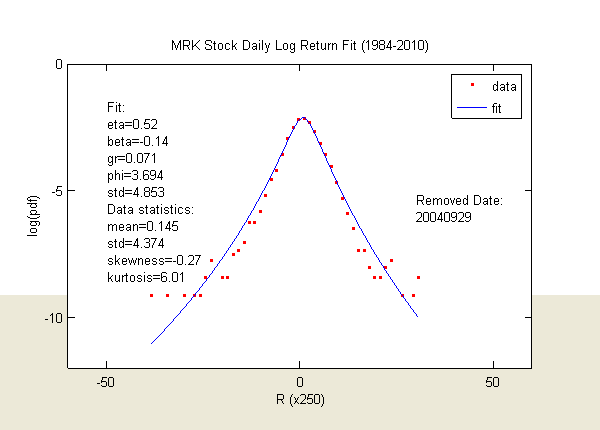
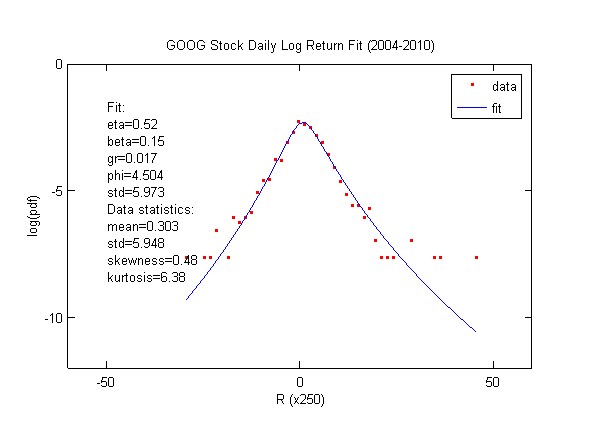
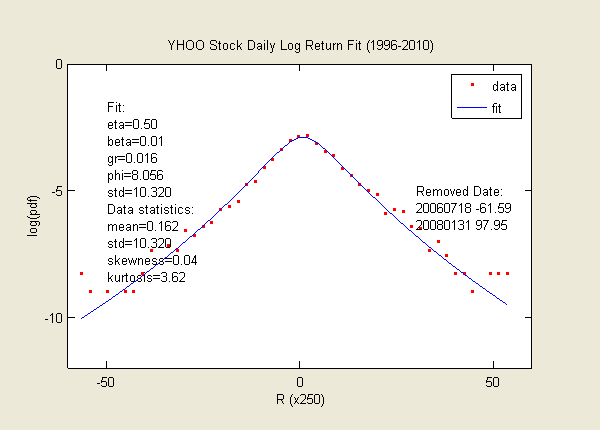
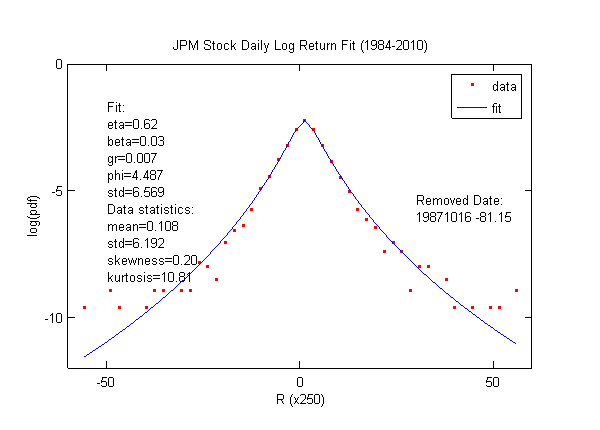
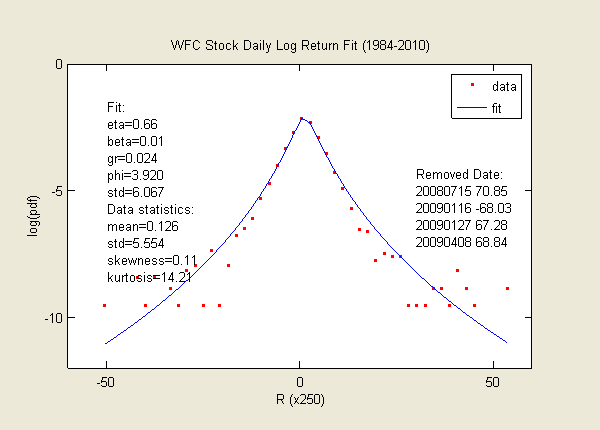
The daily log return data for a set of blue chip stocks over the past 30 years are presented here: GE, XOM, GS, BRK.A, WMT, TGT, MSFT, MRK, GOOG, YHOO, JPM and WFC. Their kurtoses are around 10, and they fit well with eta near 0.5 to 0.6 when the company history is long enough.
Sometimes a stock suffers a sudden crash, such as the 1987 crash, the Merck VIOXX recall or the large volatility of the 2008 financial crisis. A stock can also jump, as Yahoo did during merger talks with Microsoft. Those one day drops and jumps are difficult to capture in the first order distribution. To obtain a better fit to the majority of the data, the extra large one day price changes are removed. In these cases the measured kurtoses look lower than in the actual data.
The conclusion is that all stocks likely have a minimum eta near 0.5, or a kurtosis above 5 to 10. This adds strong evidence that tail risk is omnipresent. Anything that can deteriorate and die has tail risk.
General Electric was the oldest industrial company in the set. Goldman Sachs was the investment banking power house. Berkshire Hathaway is Warren Buffett's empire. ExxonMobil is the energy giant. Walmart is the price leader. Target stands for value. Microsoft dominated personal computing. Merck was the blockbuster drug researcher. Google became the internet search giant. Yahoo was the search pioneer. JPMorgan led the Morgan family. Wells Fargo was the disciplined banker. Data is split and dividend adjusted.
Data source: Yahoo Finance.
Related fits
Compare the shape.
Source shelf
Data and further reading
- Yahoo FinanceMarket data and historical quotes used for several series.
- Nasdaq CompositeOfficial index information for the Nasdaq Composite.
- Federal Reserve Economic DataEconomic time series from the Federal Reserve Bank of St. Louis.
- Lihn 2008 on SSRNThe 2008 working paper on the scale invariant Brownian motion model.
- Lihn 2009 on SSRNThe working paper on higher order lognormal cascade distributions.
- Clark 1973Subordinated stochastic process model for speculative prices.
- Fernholz 2002Stochastic portfolio theory and the diversity index.
- Heavy tailed distributionsA reference overview of distributions with heavy tails.
- Lognormal distributionDefinition and properties of the lognormal distribution.
- Mandelbrot 1963The variation of certain speculative prices.
- Fat tailed distributionsA reference overview of heavy tailed probability distributions.
- Stochastic portfolio theoryA reference overview of stochastic portfolio theory.