Data atlas / stock index
Nikkei 225 Daily Log Return
The fit has the same variance tradeoff as the Dow, but the negative skew is much smaller.
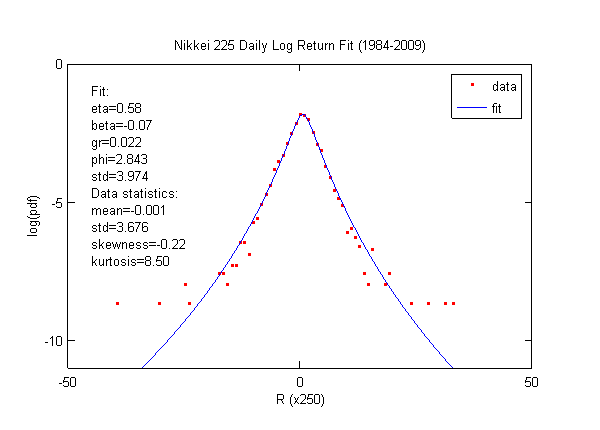
The fit exhibits a similar issue to the DJIA. In order to fit skewness and kurtosis precisely, the standard deviation is about 10 percent larger than the actual value.
Nikkei 225 negative skewness is much smaller than that of the US stock market. The reader can compare this fit with the Russell 2000 on this website. They have similar amounts of data over the same period, and their second and fourth moments are close. Because of the large volatility of the late 1980s and early 1990s, the adjusted Nikkei return during this period is inferior to that of the Russell 2000.
Data source: Yahoo Finance.
Related fits
Compare the shape.
Source shelf
Data and further reading
- Yahoo FinanceMarket data and historical quotes used for several series.
- Nasdaq CompositeOfficial index information for the Nasdaq Composite.
- Federal Reserve Economic DataEconomic time series from the Federal Reserve Bank of St. Louis.
- Lihn 2008 on SSRNThe 2008 working paper on the scale invariant Brownian motion model.
- Lihn 2009 on SSRNThe working paper on higher order lognormal cascade distributions.
- Clark 1973Subordinated stochastic process model for speculative prices.
- Fernholz 2002Stochastic portfolio theory and the diversity index.
- Heavy tailed distributionsA reference overview of distributions with heavy tails.
- Lognormal distributionDefinition and properties of the lognormal distribution.
- Mandelbrot 1963The variation of certain speculative prices.
- Fat tailed distributionsA reference overview of heavy tailed probability distributions.
- Stochastic portfolio theoryA reference overview of stochastic portfolio theory.