|
|
|
|
|
|
|
|
|
|
|
|
Data is both split and dividend adjusted.
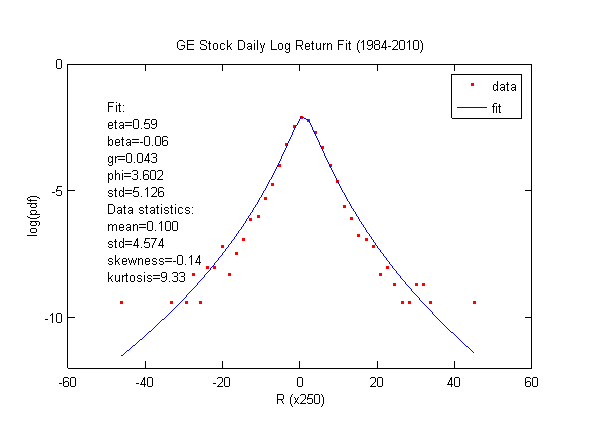
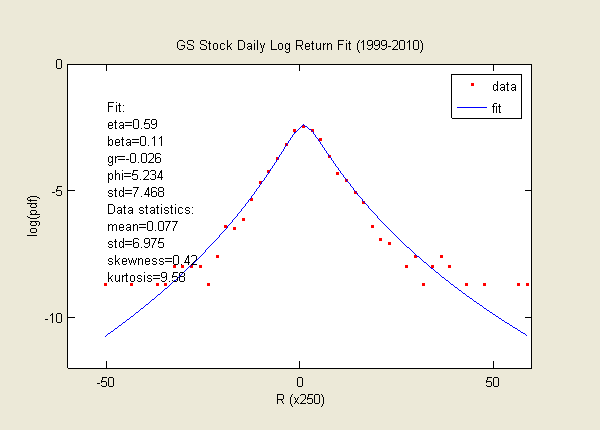
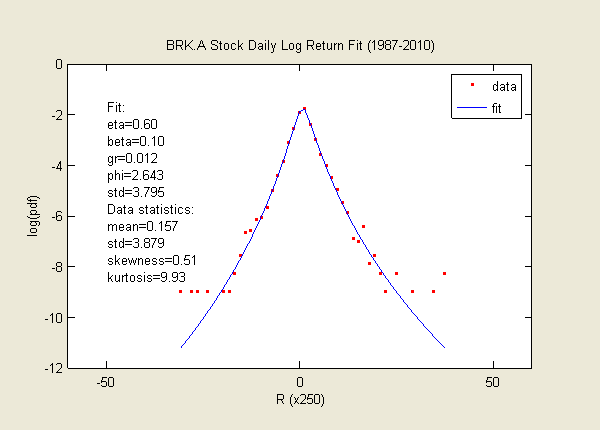
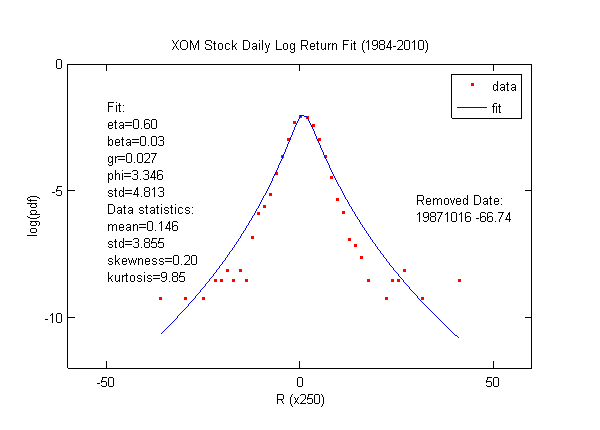
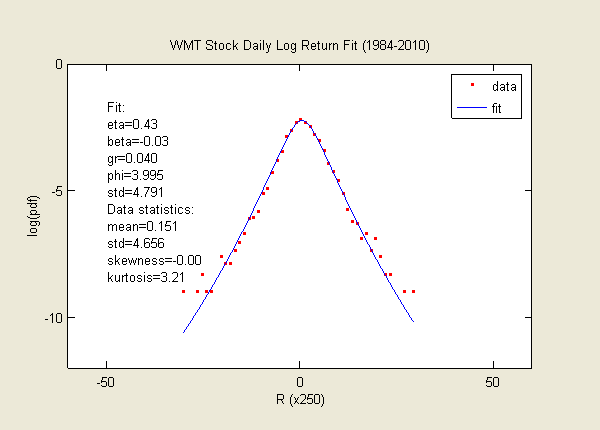
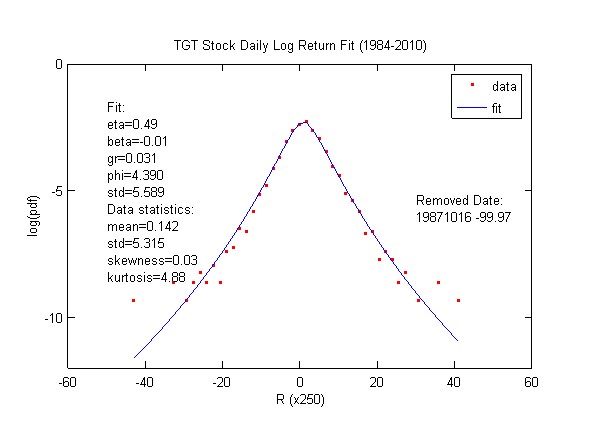
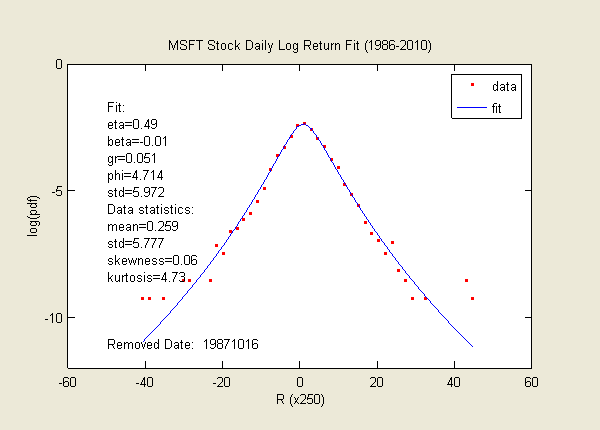
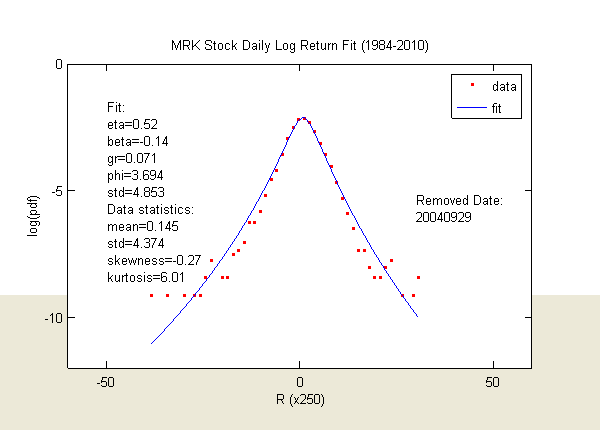
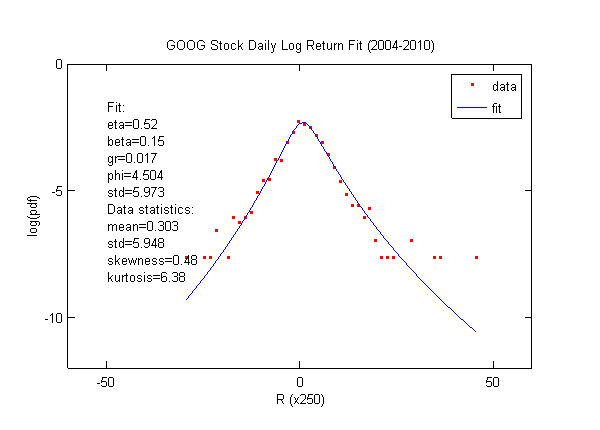
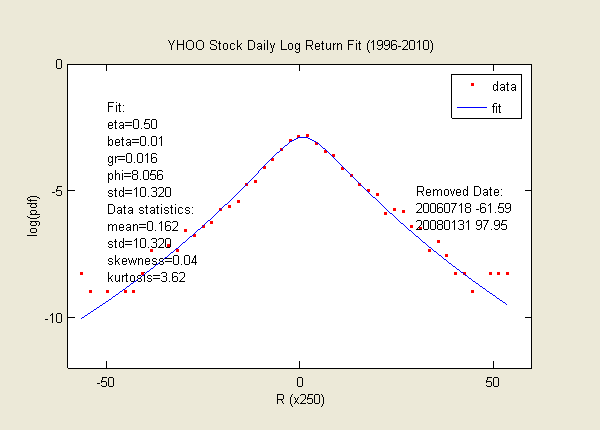
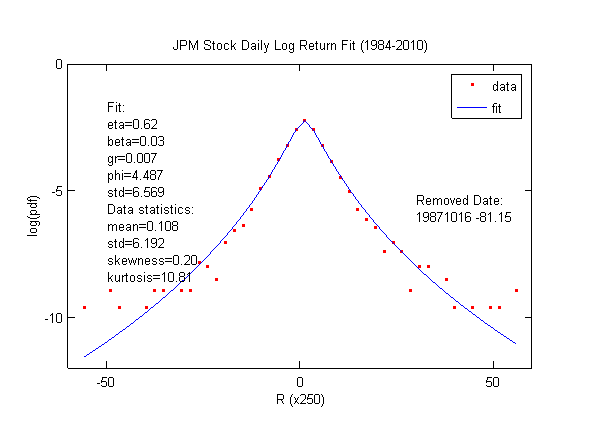
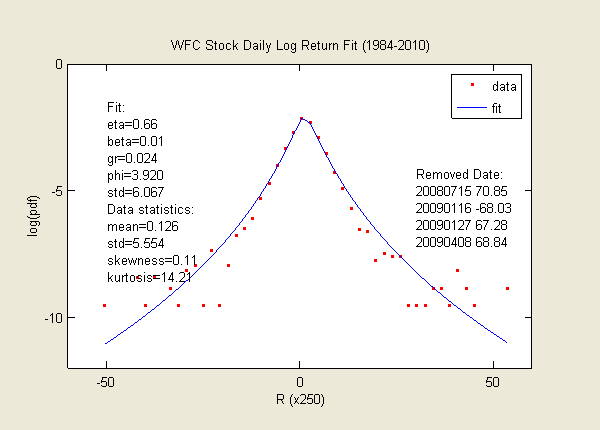
The daily log return data for some blue chip stocks during the past 30 years are presented here, e.g. GE, XOM, GS, BRK.A, WMT, TGT, MSFT, MRK, GOOG, YHOO, JPM, WFC. Their kurtoses are around 10 and fit well with eta near 0.5-0.6 (given long enough company history).
Sometimes, a stock could suffer sudden crashes (e.g. 1987 crash, MRK's VIOXX recall, large volatility during 2008 financial crisis) or jump events (YHOO's merger talks with MSFT). Those one-day drops/jumps (so called jump process) are difficult to capture in the first order distribution (which we use here). In order to obtain a better fit to the rest majority of data set, those extra-large one-day price changes have to be removed. In these cases, the kurtoses will look lower than in the actual data.
Conclusion? It seems quite likely that all the stocks have a minimum eta ~ 0.5 (Or kurtosis of more than 5-10 if you like that presentation better). This adds to the strong evidence that tail risk is omnipresent. In fact, philosophically speaking, anything that can deteriorate and die have tail risk.

|

|

|

|

|

|

|

|

|

|

|

|
Data is both split and dividend adjusted.